Plotting library
In order to facilitate plotting results using PyLogGrid, the library plotLib provides a number of utilities.
Note
An interactive notebook showcasing the functions discussed below is available in Utils/plotting.
Unified formatting
Importing plotLib automatically runs initFormat(), which sets up a number of formatting options for all plots. Those formatting options are chosen for scientific-style, quick graphs.
Note
If you itend to create cleaner figures for articles, you can call .initFormat(rcParams={"text.usetex": True}).
The default style, shown below, cycles through colors and line/marker styles. The color palette is colorblind-friendly and perceptually uniform.
Common functions
Three functions, pltshowm() labels() scatter(), wrap around the matplotlib.pyplot equivalents show() xlabel() scatter().
pltshowm
pltshowm() calls show() with additional arguments, such as the ability to maximize the figure, to save it to disk, to hide the legend, or to change the layout.
labels
scatter
scatter() calls plot() to mimic the behavior of scatter() while cycling on the same parameters as lines (instead e.g. of having a separate color cycler).
Axes
plot2axes() and plot2axesX() return either vertical or horizontal twin axes.
Sliders
PyLogGrid provides a number of helpers to produce interactive graphs depending on a slider, typically to browse through different simulation steps.
dec_enable_slider_save() is a decorator used on functions that return a slider, used to enable saving slider animations to video. It’s automatically enabled for the default interactive functions.
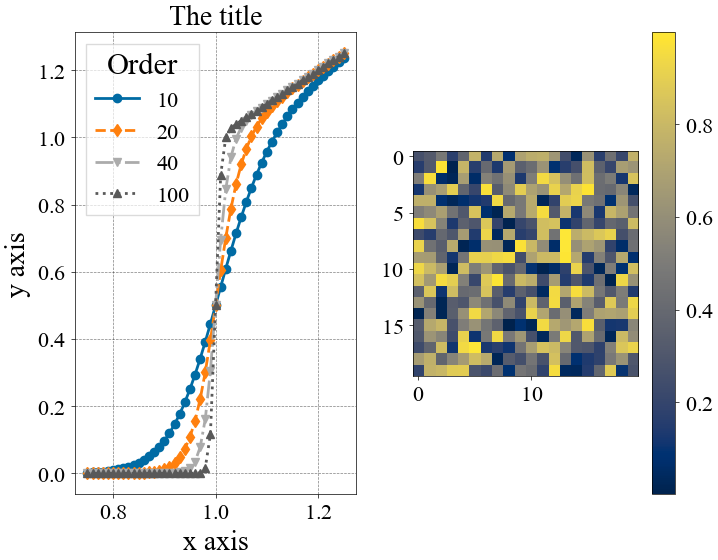
interactive_spectrum() plots on the left side spectra (log-log) and on the right side time-dependent scalars (lin-lin).

interactive_3D_logplot_by_z() makes a 3D plot of 2D aggregates of a 3D field. It either plots only a given z-plane, or all z-planes together. The vertical coordinate shows the amplitude of the field. If we plot a single z-plane, the color shows the phase of the field. If all z-planes are aggregated, the color shows the highlighted z-plane.

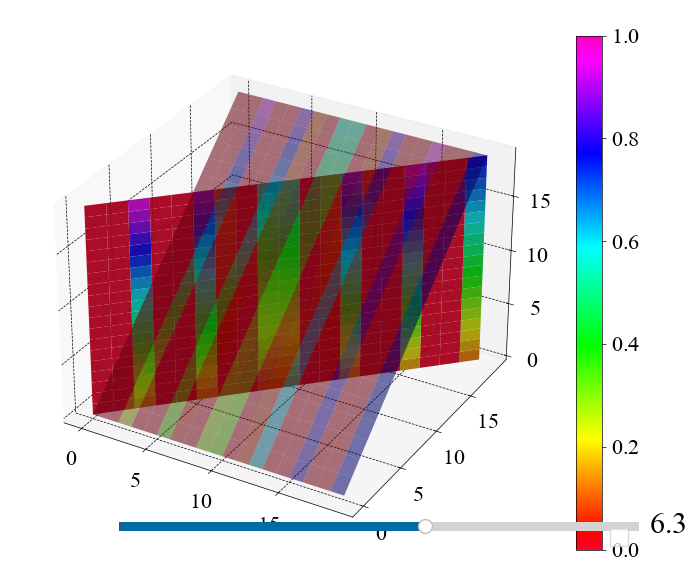
interactive_3D_logplot_positive() only works on the k_x,k_y,k_z>0 quadrant, and can single out points whose module is greater than a threshold.

interactive_3D_logplot_positive() shows diagonal slices of a 3D field, with a threshold.
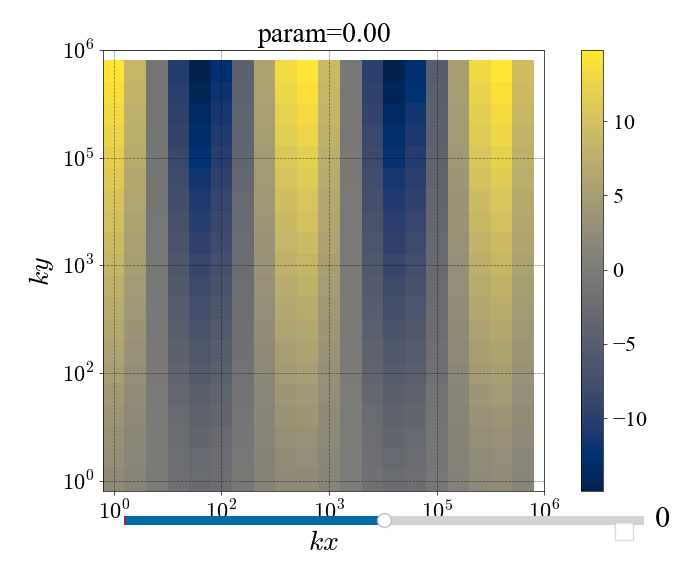
interactive_grid_imshow() shows a 2D interactive imshow().