Results
Full simulation file
Step-by-step
Heat transfer
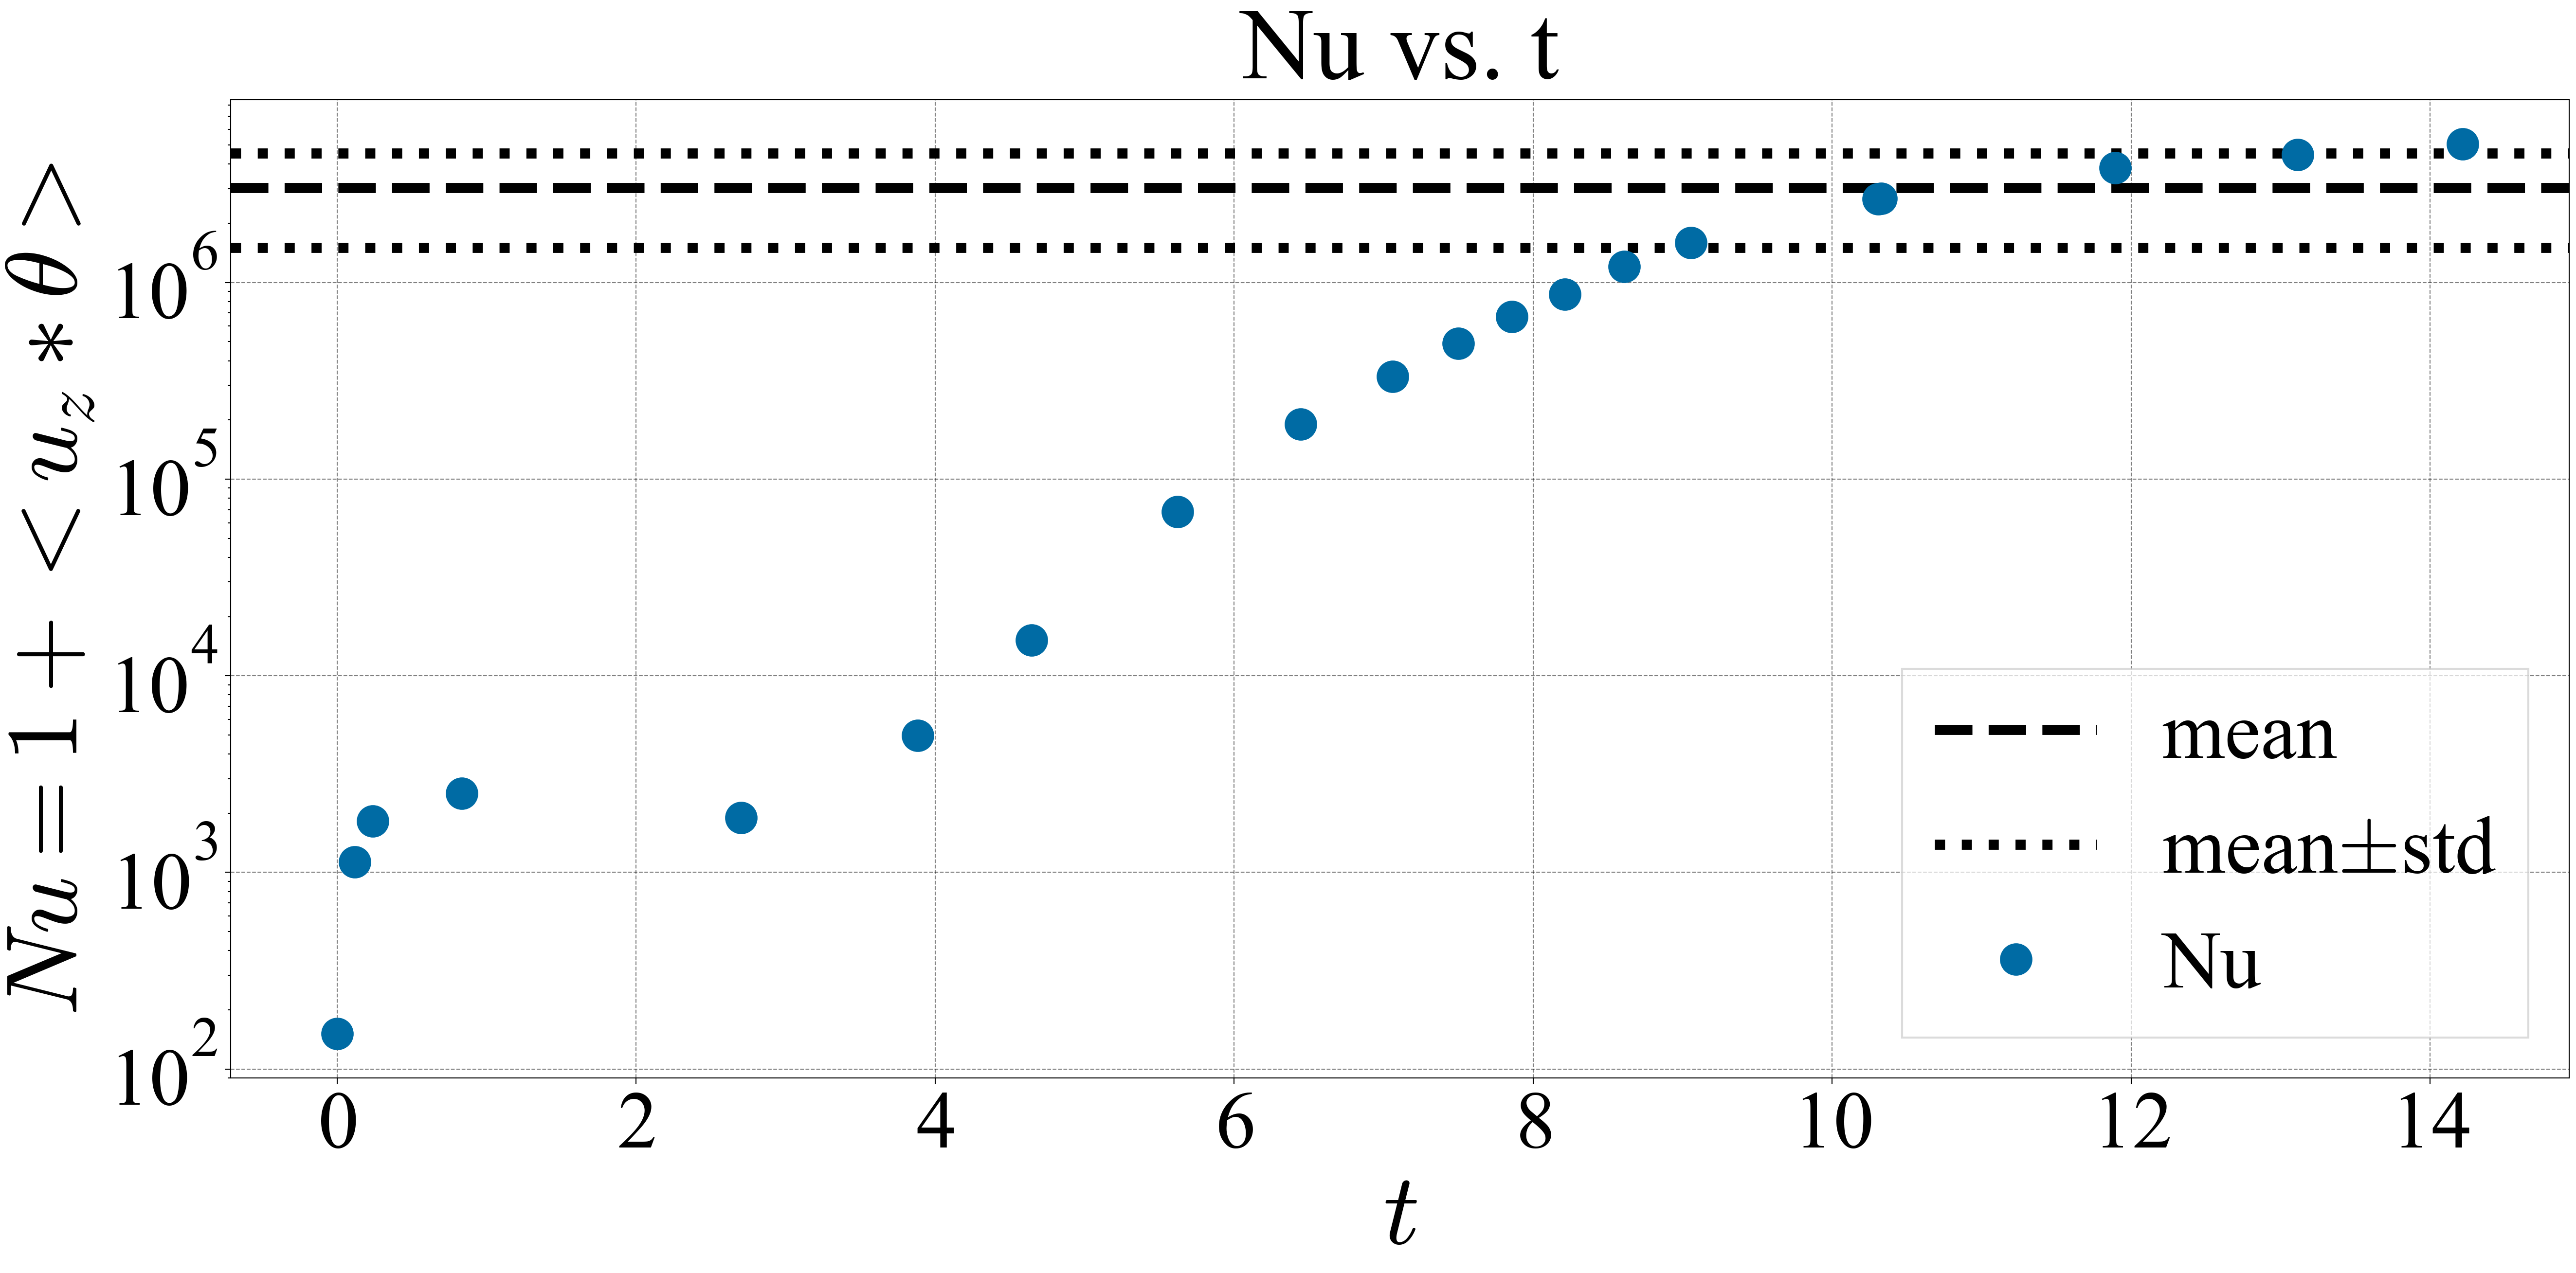
Plotting the heat transfer \(Nu\):
def get_Nu(grid: Grid, _t: float, simu_params: dict) -> dict:
    """Nusselt"""
    uz, theta = grid.field("uz", "theta")
    Ra, Pr = simu_params["Ra"], simu_params["Pr"]

    instab = grid.maths.inner_product(uz, theta)
    theta_uz_mean = np.abs(instab.real) / grid.V * np.sqrt(Ra * Pr)
    Nu = theta_uz_mean - 1
    return {"Nu": Nu, "instab": instab}


def plot_Nu(drawables: PlotFun) -> None:
    """Nusselt and exponential instabilities"""
    ts, Nu, instab = drawables("t", "Nu", "instab")

    show_instab = False
    if show_instab:
        mask = ts > ts[-1] / 2
        lnb, xi = datasci.fit(lambda t, lnb, xi: lnb + xi * t, ts, np.log(np.abs(instab)), mask)
        a = np.exp(lnb)
        plt.plot(ts[mask], a * np.exp(ts[mask] * xi), "--", label=rf"instability fit $\propto e^{{\sigma t}}$, $\sigma={xi:.3}$", linewidth=11)
        scatter(None, ts, np.abs(instab), label=r"$u_z\theta$")

    mask = ts > ts[-1] / 2
    mean, std = datasci.mean(Nu[mask], ts[mask])
    err = std
    plt.axhline(y=mean, linestyle="--", color="black", label="mean")
    plt.axhline(y=mean + err, linestyle=":", color="black", label=r"mean$\pm$std")
    plt.axhline(y=mean - err, linestyle=":", color="black")

    scatter(None, ts, np.abs(Nu), label="Nu")
    plt.yscale("log")
    labels("$t$", "$Nu=1+<u_z*\\theta>$", "Nu vs. t")
    pltshowm(save=f"{save_path}/Nu.png")
Energy distribution
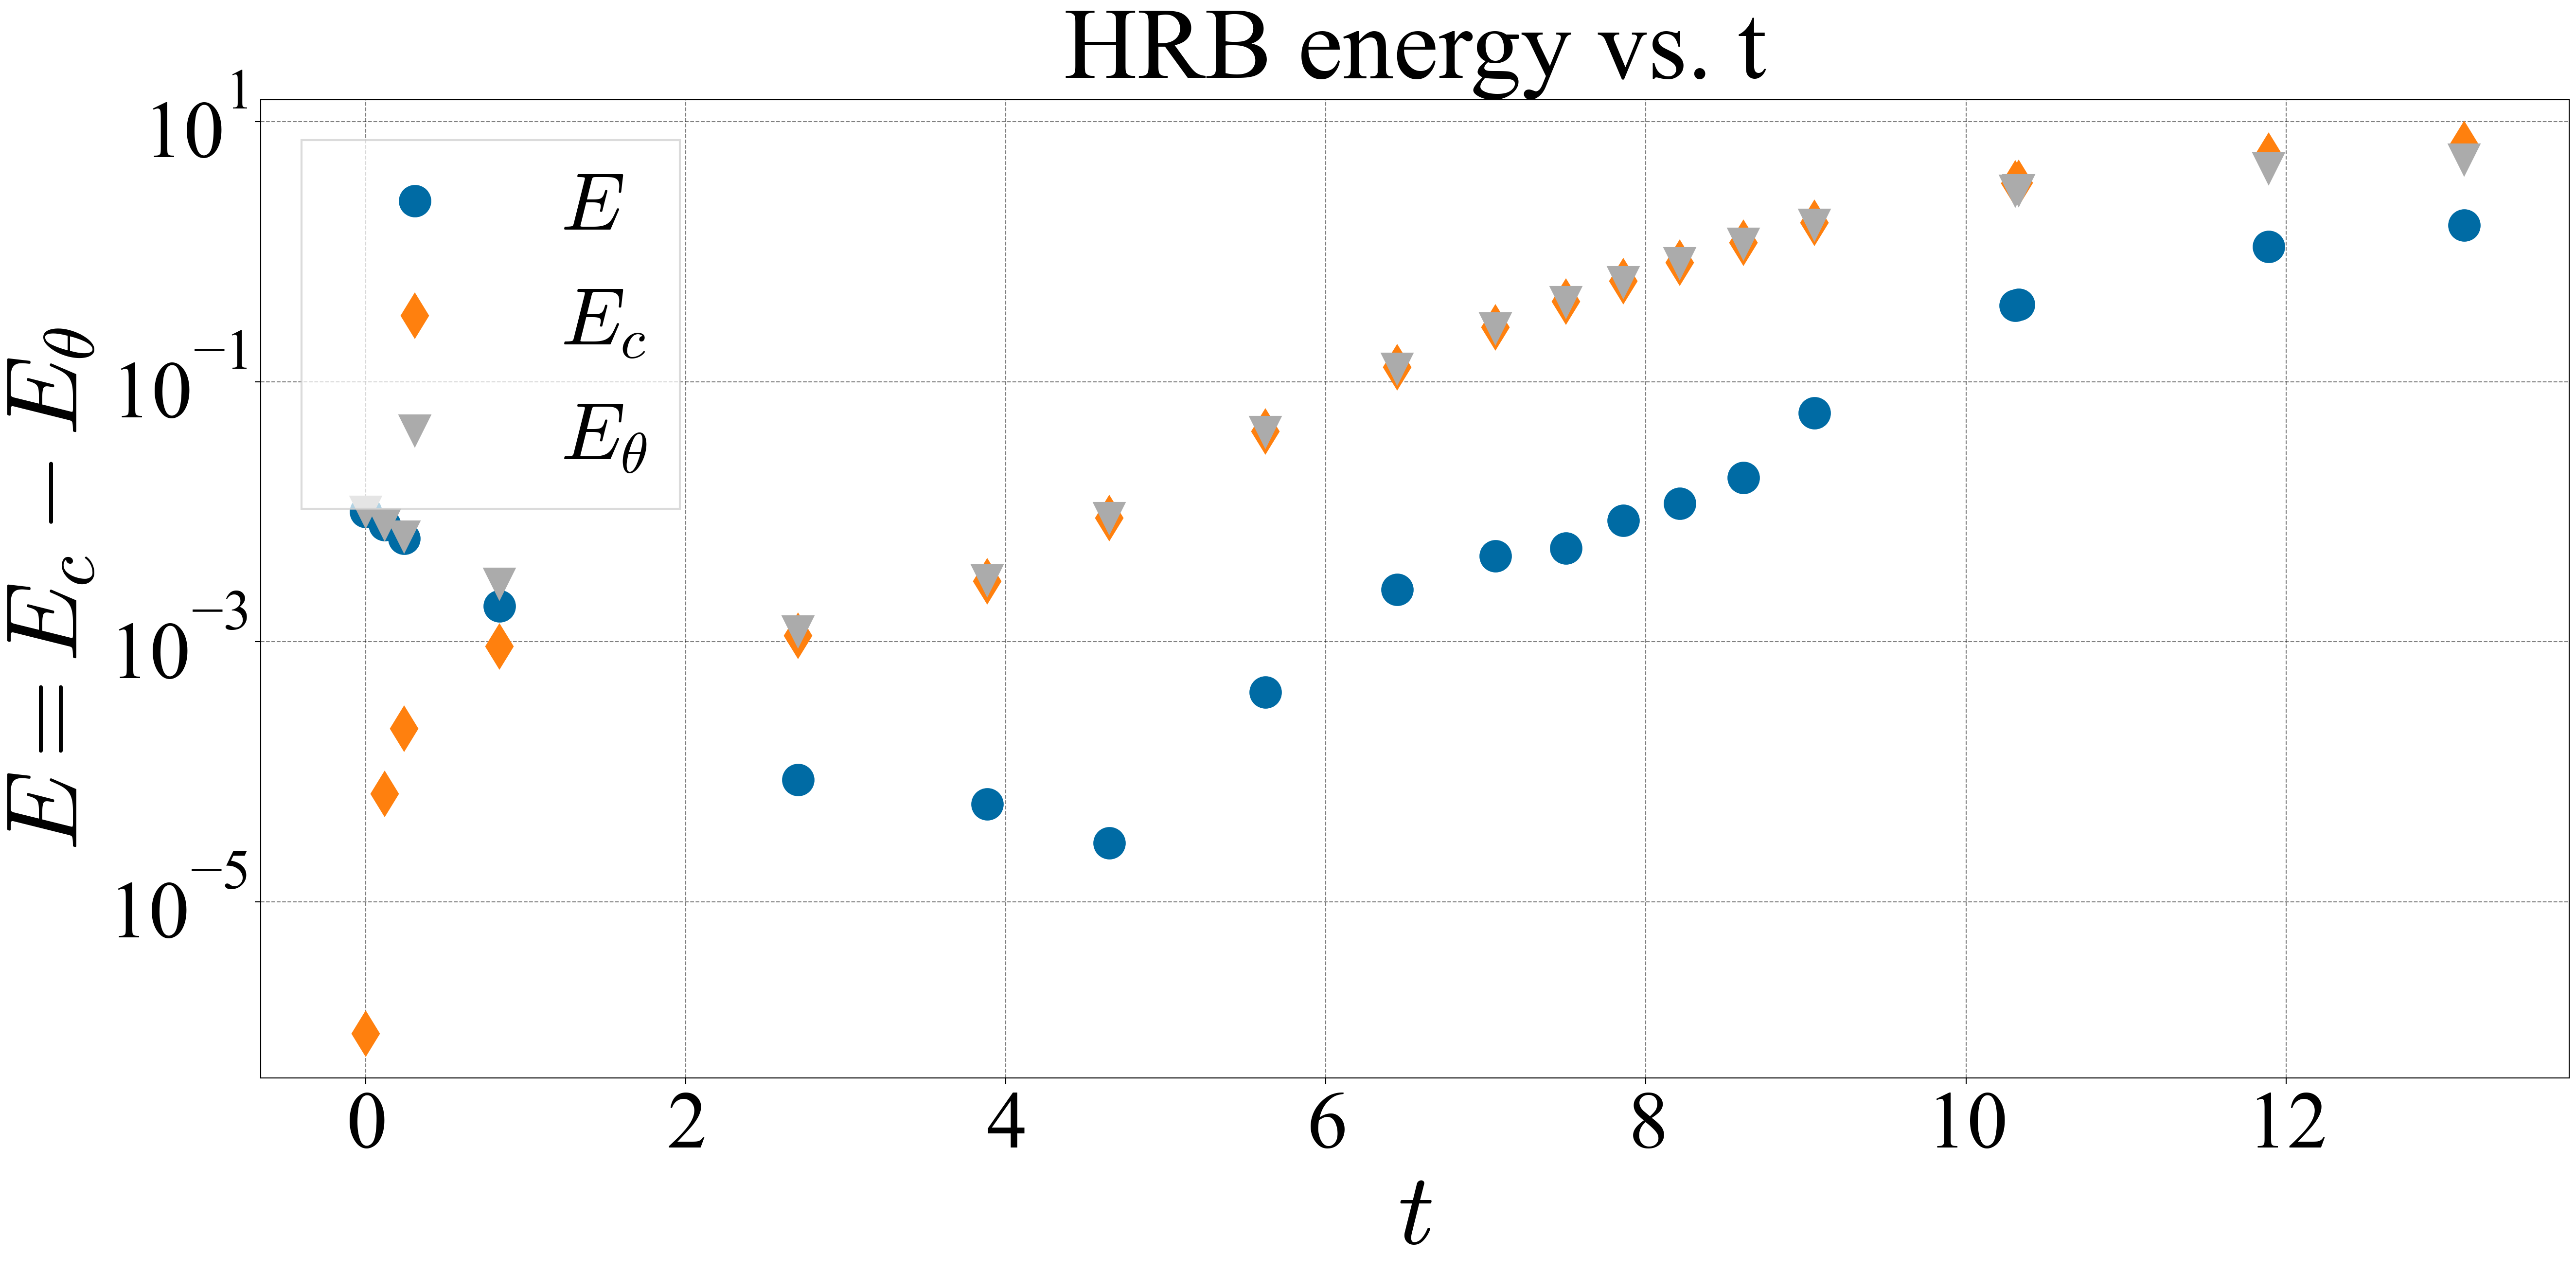
We plot the distribution of energy between thermal and kinetic energy:
def get_RBEnergy(grid: Grid, _t: float, _simu_params: dict) -> dict:
    """HRB energy"""
    theta = grid.field("theta")

    Ec = grid.physics.energy()
    Etheta = grid.maths.self_inner_product(theta) / 2
    E = np.abs(Ec - Etheta)

    return {"Ec": Ec, "Etheta": Etheta, "E": E}


def plot_RBEnergy(drawables: PlotFun) -> None:
    """HRB energy"""
    Ec, Etheta, E, ts = drawables("Ec", "Etheta", "E", "t")
    plt.yscale("log")
    scatter(None, ts, E, label="$E$")
    scatter(None, ts, Ec, label="$E_c$")
    scatter(None, ts, Etheta, label=r"$E_\theta$")
    labels("$t$", r"$E = E_c - E_\theta$", "HRB energy vs. t")
    pltshowm(save=f"{save_path}/RBEnergy.png")
Energy spectrum
def get_spectrum_and_energy(grid: Grid, _t: float, _simu_params: dict) -> dict:
    """
    LHS: spectrum vs ks
    RHS: energy vs time
    slider: time
    """

    def spectrum_kinetic(fields: dict, k: np.ndarray) -> float:
        """Kinetic energy"""
        ux, uy, uz = fields["ux"], fields["uy"], fields["uz"]
        return np.real(ux[k] * np.conj(ux[k]) + uy[k] * np.conj(uy[k]) + uz[k] * np.conj(uz[k]))

    # noinspection PyMissingOrEmptyDocstring
    def spectrum_thermal(fields: dict, k: np.ndarray) -> float:
        """Kinetic energy"""
        theta = fields["theta"]
        return np.real(theta[k] * np.conj(theta[k]))

    E_k = grid.physics.spectrum(spectrum_kinetic)
    E_k_theta = grid.physics.spectrum(spectrum_thermal)
    E_theta = grid.maths.self_inner_product(grid.field("theta")) / 2

    return {"E_k": E_k, "E_k_theta": E_k_theta, "E": grid.physics.energy(), "E_theta": E_theta, "ks": grid.ks_1D}
Interactive
def plot_spectrum_and_energy(drawables: PlotFun) -> None:
    """Plot spectra and energy"""
    ts, E_k, E_k_theta, E, E_theta, ks = drawables("t", "E_k", "E_k_theta", "E", "E_theta", "ks")
    _ = interactive_spectrum(ts, ks, {"$E_k$": E_k, r"$E_k^\theta$": E_k_theta}, {"$E$": E, r"$E_\theta$": E_theta})
    pltshowm(legend=False, compact=False)

Non-interactive
def plot_spectrum(drawables: PlotFun) -> None:
    """Plot spectra and energy"""
    ts, E_k, E_k_theta, E, E_theta, ks = drawables("t", "E_k", "E_k_theta", "E", "E_theta", "ks")
    fig = plt.figure()
    ax = plt.gca()
    ax.set_xscale("log")
    ax.set_yscale("log")
    xmin, xmax, ymin, ymax = 0.8e1, 1e5, 1e-14, 2e-2
    ax.set_ylim(ymin, ymax)
    ax.set_xlim(xmin, xmax)
    i0, i1 = len(ks) * 7 // 10, len(ks) * 10 // 10
    # i0, i1 = len(ks) * 2 // 10, len(ks) * 5 // 10
    ks_i = ks[i0]
    for i in range(i0, i1):
        if len(ks_i) < len(ks[i]):
            ks_i = ks[i]
    scatter(ax, ks_i, np.mean(ragged_array_to_array([E_k[i] for i in range(i0, i1)]), axis=0))
    ax.plot(ks_i, ks_i ** (-5 / 3) / 7, marker="", label=r"$\propto k^{-5/3}$")
    labels("$k$", "$E(k)$", "")
    ax.legend()

    left, bottom, width, height = [0.22, 0.25, 0.3, 0.4]
    ax2 = fig.add_axes([left, bottom, width, height])
    ax2.set_xscale("log")
    ax2.set_yscale("log")
    scatter(ax2, ks_i, np.mean(ragged_array_to_array([E_k[i] for i in range(i0, i1)]), axis=0))
    ax2.add_patch(patches.Rectangle((xmin, ymin), xmax - xmin, ymax + ymin, linewidth=3, edgecolor="r", facecolor="none"))

    pltshowm(legend=False)
